Track results
The Overview has the numbers by day and the campaign’s status. The Audience tab shows what’s happening with each person on the list.
Period summary
The chart on the Overview shows what the campaign did each day.
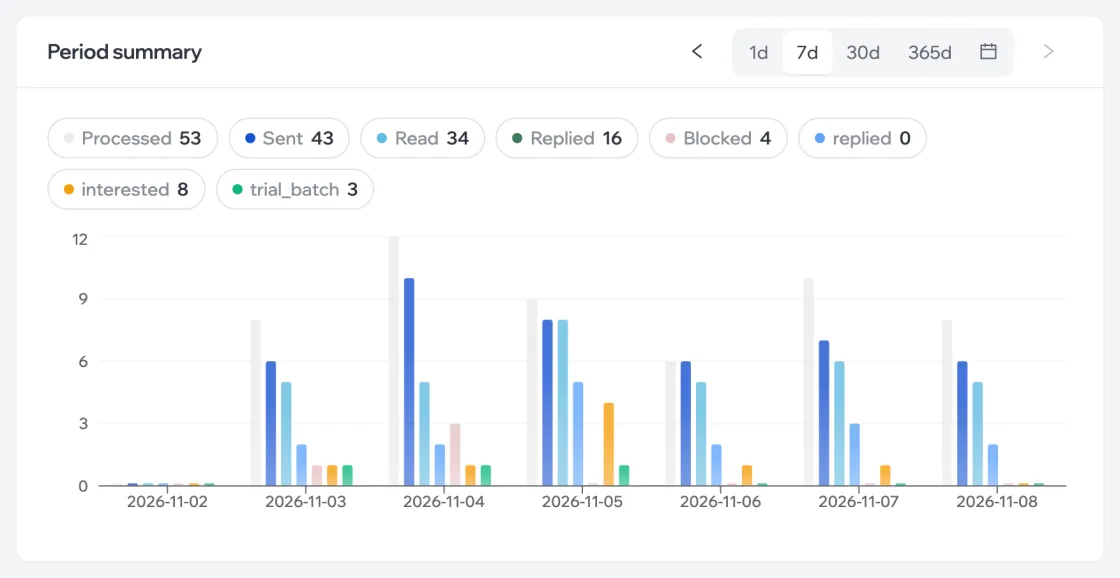
- Processed
- How many people the campaign took on, including those it couldn’t write to.
- Sent
- How many first messages actually went out.
- Read
- How many people read the message or replied.
- Replied
- How many people replied at least once.
- Blocked
- How many people blocked the sender.
Next to them are the script’s conversions that have “Show” turned on. Click a metric to hide its bars on the chart or bring them back. The period is 1, 7, 30 or 365 days, or a custom range from the calendar; the arrows move it back and forth.
Status
The Status block next to the chart: total sent, how many people from the list are still left, how many accounts are attached, and the audit.
Campaign audience
The Audience tab is the campaign’s whole list: each person’s dialog status, number of messages, conversions and variable values.
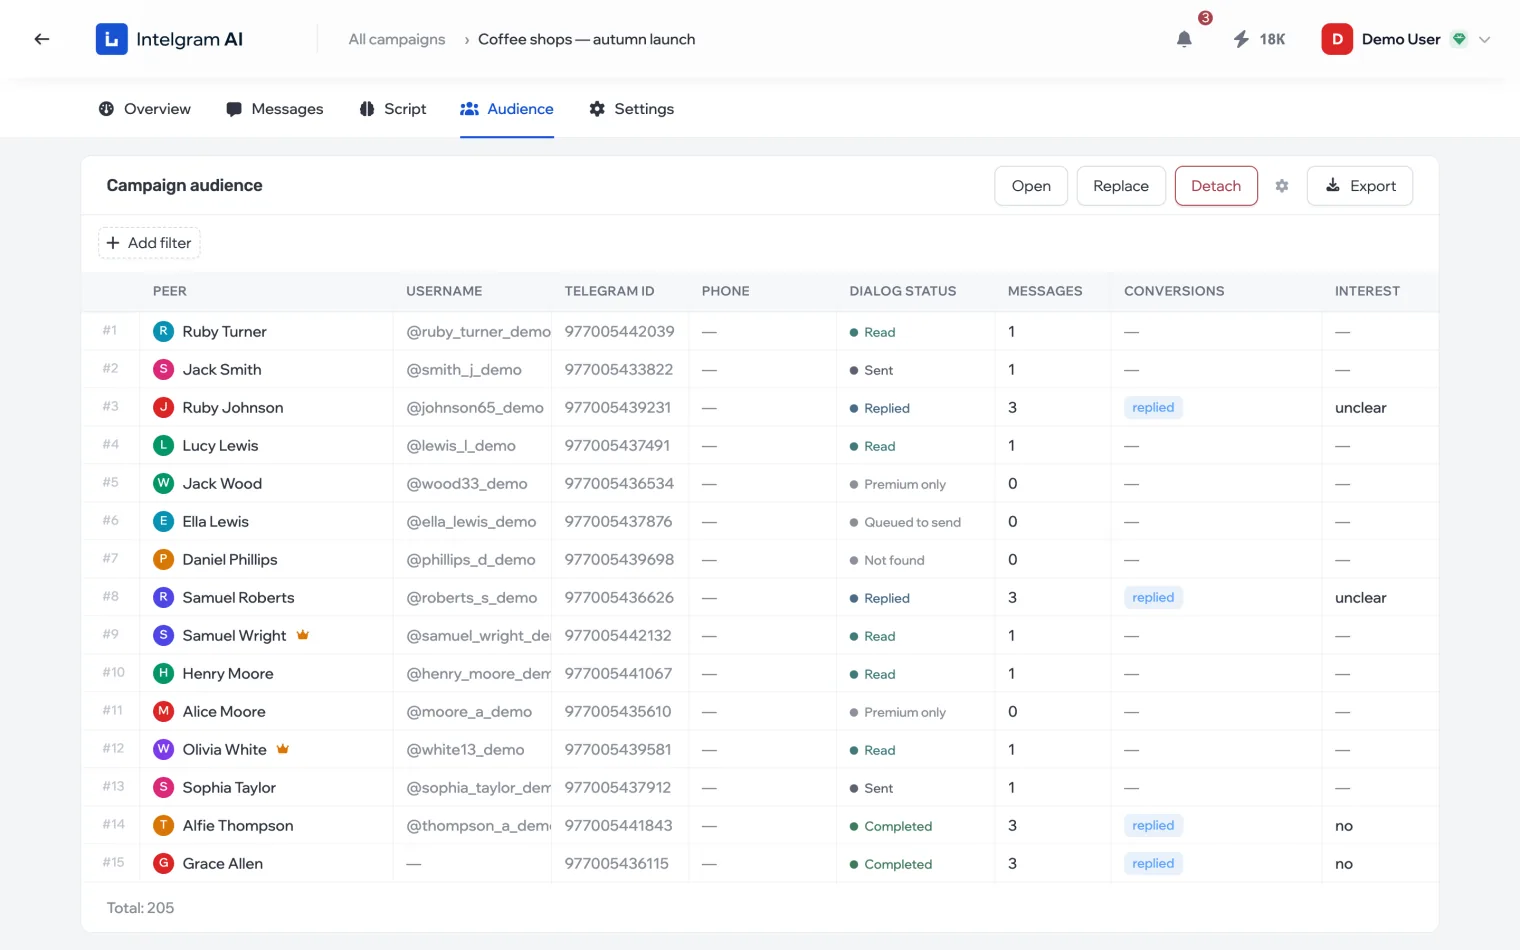
The status shows which step a person is at: queued, sent, read, replied — or why they weren’t messaged: not found, accepts messages from Premium users only, duplicate. All statuses are in the reference. You can filter the table with Add filter.
Export
Click Export and a CSV file with the whole table is put together. You can leave the page — the export keeps going. When the file is ready, click Download report. The file is available for an hour.
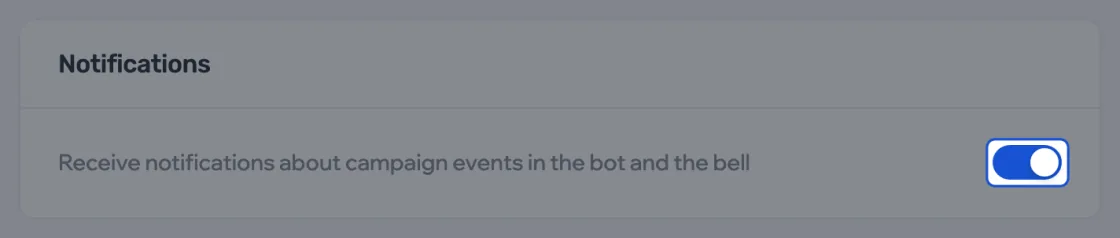
Notifications
In the campaign’s Settings, turn on Notifications — campaign events, such as hot lead notifications from the script, will come to the bot and the bell. Everyone with access to the campaign has their own switch.